Recently, I came across a report called "Entombed, An archaeological examination of an Atari 2600 game" by John Aycock and Tara Copplestone. Tara is from the Centre for Digital Heritage at the University of York, which sounds like an awesome place to work if I have ever heard one. John and Tara not only tell the story of Entombed, a game which in many ways defies expectations for a title on the Atari 2600, but they also go to great length reverse engineering its inner workings. I really enjoyed reading their well-written and interesting report.
One thing I kept thinking about after reading the article is that, while John and Tara were able to discover almost all of the inner workings of Entombed, one core mystery remained unsolved. At the heart of Entombed's level generation algorithm lies a 32-row so-called Mystery Table, and John and Tara never entirely were able to figure out how works exactly, and why. Earlier, John had talked about Entombed to Steve Sidley, who had worked on its development at a company called Western Technologies Inc. back in the 80s. Steve indicated that the Mystery Table originated in a drunk late-night coding session by a "stoner who had left" (the company). Even while Entombed was still under development, that stoner, whose identity is not revealed, was unable to remember how the Mystery Table worked, and nobody at Western Technologies was able to figure it out either. So, even back in 1983, when Entombed was shipped, the Mystery Table already was a mystery!
The story of the Mystery Table really fascinated me! While it is quite common that we do not fully understand archaeological artifacts that are thousands of years old, there is something special about our inability to explain a 1983 video game. So, intrigued by this mystery, and armed with some computational logic methodology I set out to unravel the Mystery Table's secrets. And while I ultimately succeeded, it was not quite as easy at I had hoped!
1982 was a different time for video games. While Nintendo's NES was still a year into the future, the Atari 2600 dominated the home console market. With 128 bytes of RAM, and cartridge sizes ranging from 2000 to 8000 bytes, most games were incredibly simple, even compared to the NES' library. Yes, that's 128 bytes! The amount of memory you would be forgiven to use to store a 4-by-4 matrix nowadays! Despite these severe limitations, third party developer Western Technologies Inc. built an impressive a game on the system in which the player explores a seemingly endless series of different mazes: Entombed. With the Atari's tiny cartridges and little RAM, there was no other way to pull this off than to generate these mazes procedurally at runtime.
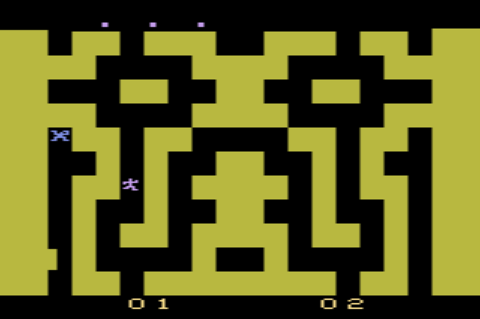 A scene from Entombed
As you play Entombed, the entire screen slowly scrolls upward. Your goal is to stay on screen, moving through a maze, while dodging enemies and collecting powerups that let you poke holes into the maze walls. As the maze scrolls, the game has to constantly generate new rows to scroll in at the bottom. A maze row consists of 20 tiles, each either being a wall tile or an empty tile. The entire maze is symmetrical, mirrored horizontally in the middle. So, in practice, the game only has to generate the left half of the maze, and the right half is obtained by mirroring. Additionally, the two outer tiles left and right are always walls. This leaves 8 tiles to procedurally generate per row.
At the heart of the algorithm generating each new maze row is the aforementioned Mystery Table. When generating a new tile, the game first checks five neighboring tiles in a certain pattern. Depending on which of those tiles are walls and which are empty, the game looks up a corresponding row in the Mystery Table. This row, in turn, tells the game whether to generate a specific tile, or pick a random tile. Let us take a closer look at how this works.
First, let us take a look at the exact shape of the neighboring tiles the game checks and looks up in the Mystery Table.
Here, X is the new tile being generated, and a, b, c, d and e are the neighboring tiles the game checks and looks up in the Mystery Table.
Next, let us take a look at the Mystery Table. The table lists all combinations of possible values for a-e, and indicates for each combination which value(s) X can take. We indicate an empty tile as 0, and a wall as 1. For X there are three possibilities: an empty tile 0, a wall 1, or a random tile selected by a random number generator each time. Here is the table.
| a | b | c | d | e | X |
|---|---|---|---|---|---|
| 0 | 0 | 0 | 0 | 0 | 1 |
| 0 | 0 | 0 | 0 | 1 | 1 |
| 0 | 0 | 0 | 1 | 0 | 1 |
| 0 | 0 | 0 | 1 | 1 | random |
| 0 | 0 | 1 | 0 | 0 | 0 |
| 0 | 0 | 1 | 0 | 1 | 0 |
| 0 | 0 | 1 | 1 | 0 | random |
| 0 | 0 | 1 | 1 | 1 | random |
| 0 | 1 | 0 | 0 | 0 | 1 |
| 0 | 1 | 0 | 0 | 1 | 1 |
| 0 | 1 | 0 | 1 | 0 | 1 |
| 0 | 1 | 0 | 1 | 1 | 1 |
| 0 | 1 | 1 | 0 | 0 | random |
| 0 | 1 | 1 | 0 | 1 | 0 |
| 0 | 1 | 1 | 1 | 0 | 0 |
| 0 | 1 | 1 | 1 | 1 | 0 |
| 1 | 0 | 0 | 0 | 0 | 1 |
| 1 | 0 | 0 | 0 | 1 | 1 |
| 1 | 0 | 0 | 1 | 0 | 1 |
| 1 | 0 | 0 | 1 | 1 | random |
| 1 | 0 | 1 | 0 | 0 | 0 |
| 1 | 0 | 1 | 0 | 1 | 0 |
| 1 | 0 | 1 | 1 | 0 | 0 |
| 1 | 0 | 1 | 1 | 1 | 0 |
| 1 | 1 | 0 | 0 | 0 | random |
| 1 | 1 | 0 | 0 | 1 | 0 |
| 1 | 1 | 0 | 1 | 0 | 1 |
| 1 | 1 | 0 | 1 | 1 | random |
| 1 | 1 | 1 | 0 | 0 | random |
| 1 | 1 | 1 | 0 | 1 | 0 |
| 1 | 1 | 1 | 1 | 0 | 0 |
| 1 | 1 | 1 | 1 | 1 | 0 |
Can you spot any patterns? Well, I could not. About the Mystery Table, John and Tara, who write that "no obvious patterns in the mapping are apparent". I agree.
Before starting to uncover the Mystery Table's secrets, let us look at a small example. Suppose we have already generate the following cells at the bottom of the screen. (We skip the two leftmost cells, because special rules apply to them. We also omit the two guaranteed walls on the left.)
As the first step, we fit the pattern to the tiles that we have already generated.
This gives us a = 0, b = 0, c = 0, d = 0, and e = 1, or 00001 for short. Next, we find the corresponding row in the Mystery Table.
| a | b | c | d | e | X |
|---|---|---|---|---|---|
| 0 | 0 | 0 | 0 | 1 | 1 |
This gives us X = 1. So the next tile has to be a wall.
Next, we rinse, repeat. Fit the pattern.
Look up 01010 in the Mystery Table, which gives us another 1 and, thus, another wall.
Next, we repeat the same two steps until we obtain a full row. At the right end of the row, special rules apply again but, again, we are not going to worry about those here.
So how to approach a problem like this? Personally, I like to start out getting my hands dirty playing with the data. Even if this does not yield any major insights, this allows me to "get a feeling" for the problem, and might raise some interesting questions to approach more systematically later. As a very first step towards getting a better understanding of the Mystery Table, I decided to plot out each row. I also numbered them, so I can plot them in a different order later with an easy way to cross-reference between figures.
The Mystery Table visualizedAfter a bit of staring at this version of the Mystery Table, I realized something. For most rows, there is something like a "symmetry under inversion". So, we can usually get another valid row of the table by proceeding as follows for a given row:
For instance, inverting row 0 this way, we get row 31. I plotted out all of the table rows that are symmetric in this way, with pairs that are inverted versions of each other next to each other.
The table rows that are symmetric under inversionThis is almost the entire table! However, four rows are missing from this figure. Here are the asymmetric cases.
The table rows that are not symmetric under inversionIn each case, one pattern out of the pairs results in an empty tile being generated, while the inverted version results in a random tile. So, clearly the game has a bias towards generating empty spaces. But what makes these specific constellations special? We will get back to this question later.
After discovering the "symmetry under inversion" property, I continued staring at the plotted table, hoping to find more interesting properties of the table. While I did seem to see some interesting repeating patterns, none of them really led to any discoveries that felt relevant. So it was time to approach the problem a bit more systematically.
One way to think of our inability to understand the Mystery Table is that it is simply an unintuitive representation of underlying data. If we assume that there are simple, understandable underlying principles on which the Mystery Table is based, then there surely has to be a way to represent it that makes those principles visible. So, one way to approach gaining a better understanding of the table is to search for a better representation of its data, which makes reasoning about it easier.
The representation I decided to try are Binary Decision Diagrams, BDDs for short. BDDs are a essentially a representation for logical formulas which is in many cases quite concise. Another advantage of BDDs is that they are quite efficient to do computations on, although this property was less important for me in this context. So why BDDs? Surely there are lots of other representations we could use? There are, and to be entirely honest part of the reason is I picked BDDs is that I had worked with them before, meaning that I already knew how to use the corresponding tools, and was already able to intuitively interpret them. You know how it is with the hammer and the nails.
To understand how BDDs work, let us take a look at a few examples. Below, you can find the BDD for the formula a ∨ b. For a given set of values for a and b, you can use a BDD to determine whether the corresponding formula is true as follows.
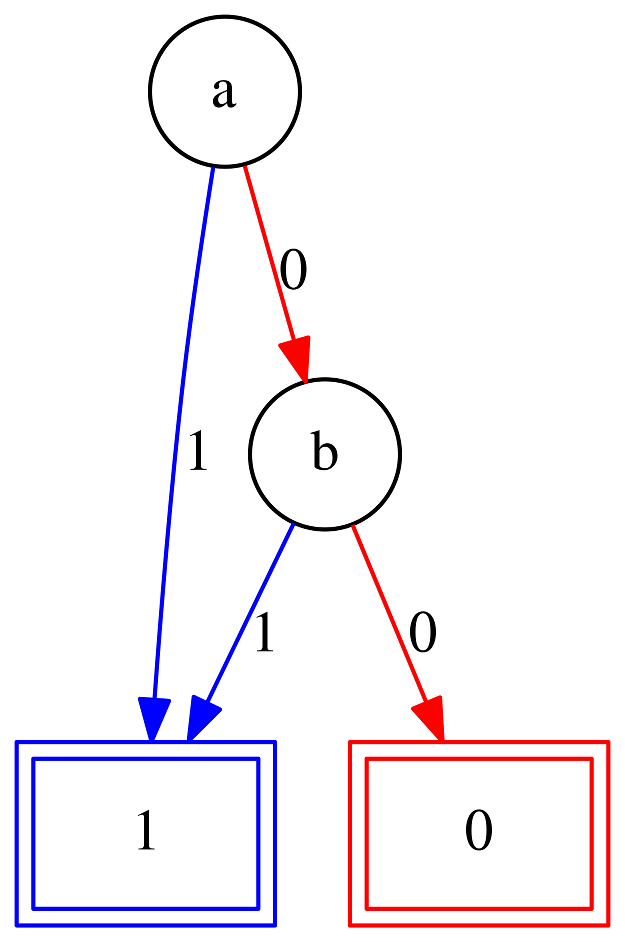 The BDD for a ∨ b
So, as an example, if we have a = 0 and b = 1, we would start taking the right edge from the top node in the figure. This would take us to the b node. From there, we would take the left edge to the leaf labeled 1, telling us that this underlying formula is true.
If, in contrast, we have a = 1 and b = 0, then we would go straight from the initial a node to the leaf labeled 1.
Even in this trivial example, looking at the BDD tells us something about the formula a ∨ b, namely that we only need to care about the value of b if a is 0. While this might be quite obvious in this trivial example, the idea behind representing the Mystery Table was to make similar, less obvious observations.
Each BDD has a specific variable ordering, which defines in the order in which we can encounter variables when moving through the BDD. In the previous example, the variable ordering was a, b. In practice, the variable ordering can often have a huge impact on how large the BDD for a given formula is. In addition, the variable ordering also affects the observations we can make about the underlying formula. For instance, in the previous example our observation would probably have been "we only care about the value of a if b is 0" if we had picked the variable ordering b, a. So how do we make sure we pick the right variable ordering leading to the correct observations for the Mystery Table? We cannot. Instead, we will pick the variable ordering that minimizes the size of the BDD and go from there.
Before we go back to looking at the Mystery Table, there is one more BDD I would like to show to you. This BDD is important, because we will similar structures in multiple places of the Mystery Table BDD later. The BDD I would like to show you is the BDD for the formula a = b.
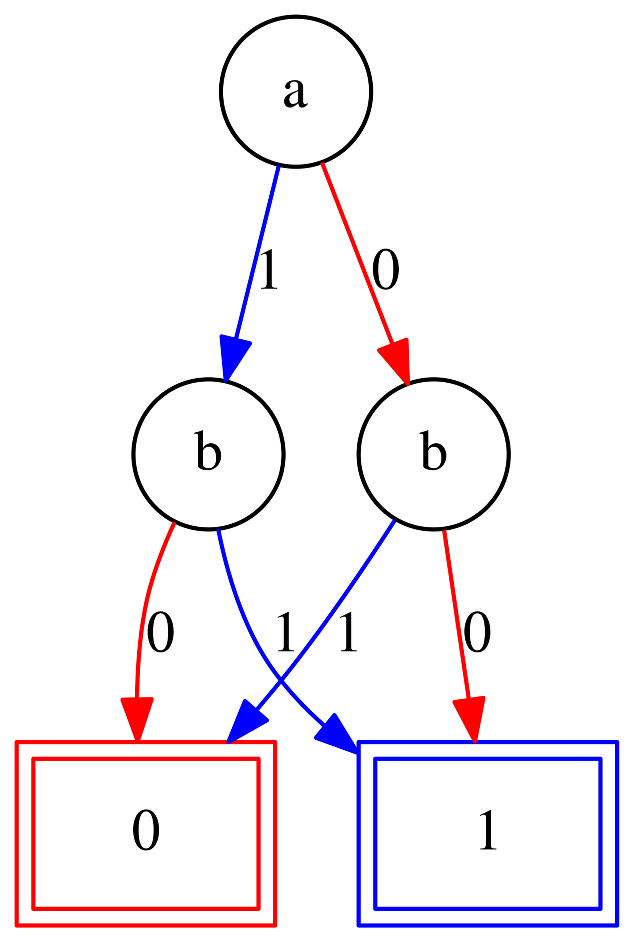 The BDD for a = b
One way to describe this BDD is that is sort of looks like two overlapping diamond shapes. The first diamond shape consists of the two paths ending in the 0 leaf. Likewise, the second diamond shape consists of the paths ending in 1. The top part of both diamond shapes consists of the paths out of the a a node, here the two diamonds overlap. Let us try to remember this shape, so that later when we look at the Mystery Table BDD we spot parts of the diagram that work similarly.
Before we can turn the Mystery Table into a BDD, we actually have to solve one problem: the Mystery Table has three possible outputs, not two. So how do we solve this issue? Well, we could just define our own "slightly ternary decision diagrams", which work like BDDs but can have three leaves. The downside of this approach is that at this point we would be on our own when it comes to tools. If we want to use existing tools rather than writing our own, we need to somehow shoehorn the Mystery Table into a BDD with just two leaves. One way to do this is to encode the output of the table as part of the formula rather than as the BDDs leaf nodes. We do this by adding two variables X and R to the underlying formula, where R indicates random output, and X indicates the value of output if it is not random:
| R | X | Corresponding output |
|---|---|---|
| 0 | 0 | 0 |
| 0 | 1 | 1 |
| 1 | 0 | random |
| 1 | 1 | -invalid- |
Using this encoding, we can encode the rows of the Mystery Table as follows:
| a | b | c | d | e | X | Formula |
|---|---|---|---|---|---|---|
| 0 | 0 | 0 | 0 | 0 | 1 | ¬a ∧ ¬b ∧ ¬c ∧ ¬d ∧ ¬e ∧ ¬R ∧ X |
| 0 | 0 | 0 | 0 | 1 | 1 | ¬a ∧ ¬b ∧ ¬c ∧ ¬d ∧ e ∧ ¬R ∧ X |
| 0 | 0 | 0 | 1 | 0 | 1 | ¬a ∧ ¬b ∧ ¬c ∧ d ∧ ¬e ∧ ¬R ∧ X |
| 0 | 0 | 0 | 1 | 1 | random | ¬a ∧ ¬b ∧ ¬c ∧ d ∧ e ∧ R ∧ ¬X |
| 0 | 0 | 1 | 0 | 0 | 0 | ¬a ∧ ¬b ∧ c ∧ ¬d ∧ ¬e ∧ ¬R ∧ ¬X |
| 0 | 0 | 1 | 0 | 1 | 0 | ¬a ∧ ¬b ∧ c ∧ ¬d ∧ e ∧ ¬R ∧ ¬X |
| 0 | 0 | 1 | 1 | 0 | random | ¬a ∧ ¬b ∧ c ∧ d ∧ ¬e ∧ R ∧ ¬X |
| 0 | 0 | 1 | 1 | 1 | random | ¬a ∧ ¬b ∧ c ∧ d ∧ e ∧ R ∧ ¬X |
| 0 | 1 | 0 | 0 | 0 | 1 | ¬a ∧ b ∧ ¬c ∧ ¬d ∧ ¬e ∧ ¬R ∧ X |
| 0 | 1 | 0 | 0 | 1 | 1 | ¬a ∧ b ∧ ¬c ∧ ¬d ∧ e ∧ ¬R ∧ X |
| 0 | 1 | 0 | 1 | 0 | 1 | ¬a ∧ b ∧ ¬c ∧ d ∧ ¬e ∧ ¬R ∧ X |
| 0 | 1 | 0 | 1 | 1 | 1 | ¬a ∧ b ∧ ¬c ∧ d ∧ e ∧ ¬R ∧ X |
| 0 | 1 | 1 | 0 | 0 | random | ¬a ∧ b ∧ c ∧ ¬d ∧ ¬e ∧ R ∧ ¬X |
| 0 | 1 | 1 | 0 | 1 | 0 | ¬a ∧ b ∧ c ∧ ¬d ∧ e ∧ ¬R ∧ ¬X |
| 0 | 1 | 1 | 1 | 0 | 0 | ¬a ∧ b ∧ c ∧ d ∧ ¬e ∧ ¬R ∧ ¬X |
| 0 | 1 | 1 | 1 | 1 | 0 | ¬a ∧ b ∧ c ∧ d ∧ e ∧ ¬R ∧ ¬X |
| 1 | 0 | 0 | 0 | 0 | 1 | a ∧ ¬b ∧ ¬c ∧ ¬d ∧ ¬e ∧ ¬R ∧ X |
| 1 | 0 | 0 | 0 | 1 | 1 | a ∧ ¬b ∧ ¬c ∧ ¬d ∧ e ∧ ¬R ∧ X |
| 1 | 0 | 0 | 1 | 0 | 1 | a ∧ ¬b ∧ ¬c ∧ d ∧ ¬e ∧ ¬R ∧ X |
| 1 | 0 | 0 | 1 | 1 | random | a ∧ ¬b ∧ ¬c ∧ d ∧ e ∧ R ∧ ¬X |
| 1 | 0 | 1 | 0 | 0 | 0 | a ∧ ¬b ∧ c ∧ ¬d ∧ ¬e ∧ ¬R ∧ ¬X |
| 1 | 0 | 1 | 0 | 1 | 0 | a ∧ ¬b ∧ c ∧ ¬d ∧ e ∧ ¬R ∧ ¬X |
| 1 | 0 | 1 | 1 | 0 | 0 | a ∧ ¬b ∧ c ∧ d ∧ ¬e ∧ ¬R ∧ ¬X |
| 1 | 0 | 1 | 1 | 1 | 0 | a ∧ ¬b ∧ c ∧ d ∧ e ∧ ¬R ∧ ¬X |
| 1 | 1 | 0 | 0 | 0 | random | a ∧ b ∧ ¬c ∧ ¬d ∧ ¬e ∧ R ∧ ¬X |
| 1 | 1 | 0 | 0 | 1 | 0 | a ∧ b ∧ ¬c ∧ ¬d ∧ e ∧ ¬R ∧ ¬X |
| 1 | 1 | 0 | 1 | 0 | 1 | a ∧ b ∧ ¬c ∧ d ∧ ¬e ∧ ¬R ∧ X |
| 1 | 1 | 0 | 1 | 1 | random | a ∧ b ∧ ¬c ∧ d ∧ e ∧ R ∧ ¬X |
| 1 | 1 | 1 | 0 | 0 | random | a ∧ b ∧ c ∧ ¬d ∧ ¬e ∧ R ∧ ¬X |
| 1 | 1 | 1 | 0 | 1 | 0 | a ∧ b ∧ c ∧ ¬d ∧ e ∧ ¬R ∧ ¬X |
| 1 | 1 | 1 | 1 | 0 | 0 | a ∧ b ∧ c ∧ d ∧ ¬e ∧ ¬R ∧ ¬X |
| 1 | 1 | 1 | 1 | 1 | 0 | a ∧ b ∧ c ∧ d ∧ e ∧ ¬R ∧ ¬X |
Here, the last column contains a formula that is true if and only if a, b, c, d and e have the values on the same row, and if R and X encode the correct output. Now we can get a formula encoding the entire Mystery table by joining all rows with a big logical or. This gives us ¬a∧¬b∧¬c∧¬d∧¬e∧¬R∧X ∨ ¬a∧¬b∧¬c∧¬d∧e∧¬R∧X ∨ ¬a∧¬b∧¬c∧d∧¬e∧¬R∧X ∨ ¬a∧¬b∧¬c∧d∧e∧R∧¬X ∨ ¬a∧¬b∧c∧¬d∧¬e∧¬R∧¬X ∨ ¬a∧¬b∧c∧¬d∧e∧¬R∧¬X ∨ ¬a∧¬b∧c∧d∧¬e∧R∧¬X ∨ ¬a∧¬b∧c∧d∧e∧R∧¬X ∨ ¬a∧b∧¬c∧¬d∧¬e∧¬R∧X ∨ ¬a∧b∧¬c∧¬d∧e∧¬R∧X ∨ ¬a∧b∧¬c∧d∧¬e∧¬R∧X ∨ ¬a∧b∧¬c∧d∧e∧¬R∧X ∨ ¬a∧b∧c∧¬d∧¬e∧R∧¬X ∨ ¬a∧b∧c∧¬d∧e∧¬R∧¬X ∨ ¬a∧b∧c∧d∧¬e∧¬R∧¬X ∨ ¬a∧b∧c∧d∧e∧¬R∧¬X ∨ a∧¬b∧¬c∧¬d∧¬e∧¬R∧X ∨ a∧¬b∧¬c∧¬d∧e∧¬R∧X ∨ a∧¬b∧¬c∧d∧¬e∧¬R∧X ∨ a∧¬b∧¬c∧d∧e∧R∧¬X ∨ a∧¬b∧c∧¬d∧¬e∧¬R∧¬X ∨ a∧¬b∧c∧¬d∧e∧¬R∧¬X ∨ a∧¬b∧c∧d∧¬e∧¬R∧¬X ∨ a∧¬b∧c∧d∧e∧¬R∧¬X ∨ a∧b∧¬c∧¬d∧¬e∧R∧¬X ∨ a∧b∧¬c∧¬d∧e∧¬R∧¬X ∨ a∧b∧¬c∧d∧¬e∧¬R∧X ∨ a∧b∧¬c∧d∧e∧R∧¬X ∨ a∧b∧c∧¬d∧¬e∧R∧¬X ∨ a∧b∧c∧¬d∧e∧¬R∧¬X ∨ a∧b∧c∧d∧¬e∧¬R∧¬X ∨ a∧b∧c∧d∧e∧¬R∧¬X
Next, I tried to turn this beautiful beast of a formula into a BDD. Tyler Sorensen from the University of Utah hosts an awesome tool that can generate and visualize BDDs. However, the above formula is too large for the online tool, so I wrote a short script that simplified it to ¬a∧¬b∧c∧d∧¬e∧R∧¬X ∨ ¬a∧b∧¬c∧d∧e∧¬R∧X ∨ a∧b∧¬c∧¬d∧¬e∧R∧¬X ∨ a∧b∧c∧d∧e∧¬R∧¬X ∨ ¬a∧¬b∧d∧e∧R∧¬X ∨ ¬a∧b∧c∧e∧¬R∧¬X ∨ a∧¬b∧¬c∧¬d∧¬R∧X ∨ a∧¬b∧c∧d∧¬R∧¬X ∨ a∧¬c∧d∧e∧R∧¬X ∨ b∧c∧¬d∧¬e∧R∧¬X ∨ a∧b∧¬d∧e∧¬R∧¬X ∨ b∧c∧d∧¬e∧¬R∧¬X ∨ ¬a∧¬c∧¬d∧¬R∧X ∨ ¬b∧c∧¬d∧¬R∧¬X ∨ ¬c∧d∧¬e∧¬R∧X
A lot more manageable, isn't it? This formula was finally short enough for the online tool. Here is its output.
 The Mystery Table as a BDD
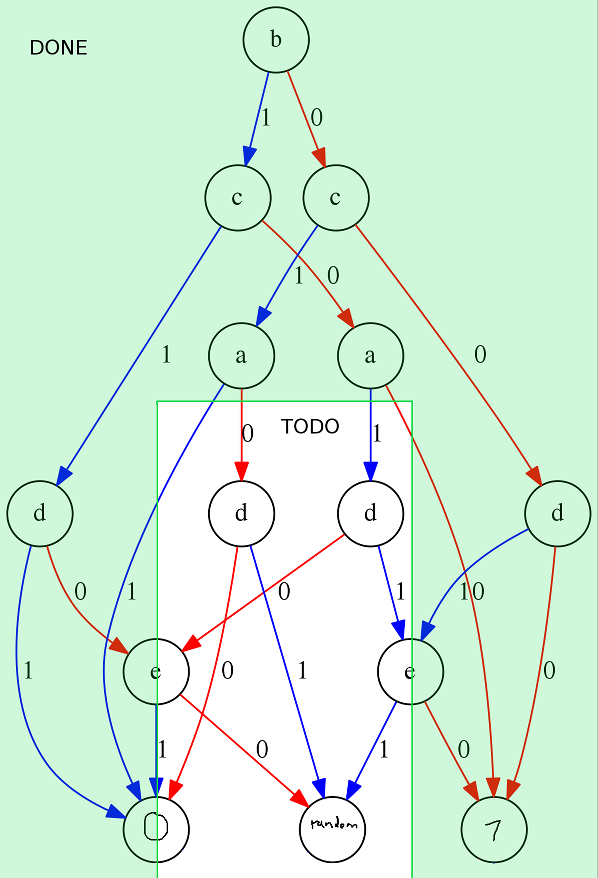
Recall, that all of the satisfying assignments of the formula we fed into the tool correspond to the rows of the Mystery Table, meaning that all paths that end in the 1-leaf encode correspond to rows of the mystery table. A path that ends in the 0-leaf, in contrast, corresponds to values for a-z, R and X that do not encode a row of the mystery table. We are not really interested in those "incorrect output" paths, so the next step is to prune those away. For this step, I used the the tried-and-true Computational Logic method of editing the image with an image manipulation program. I also cleaned up the output encoding at the same time. Here is the result.
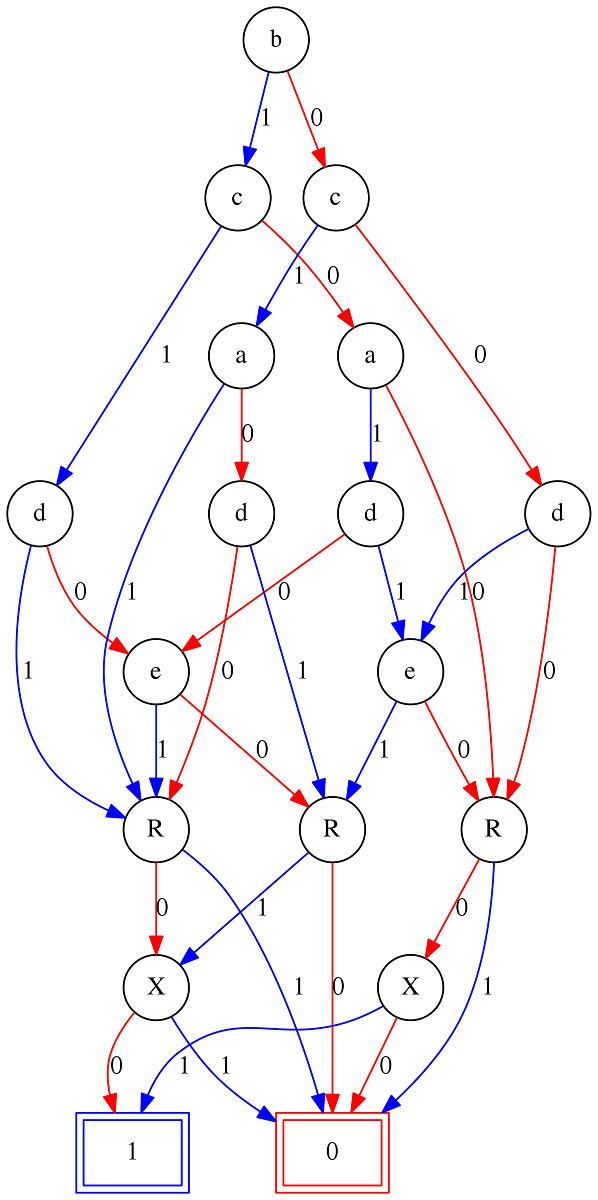
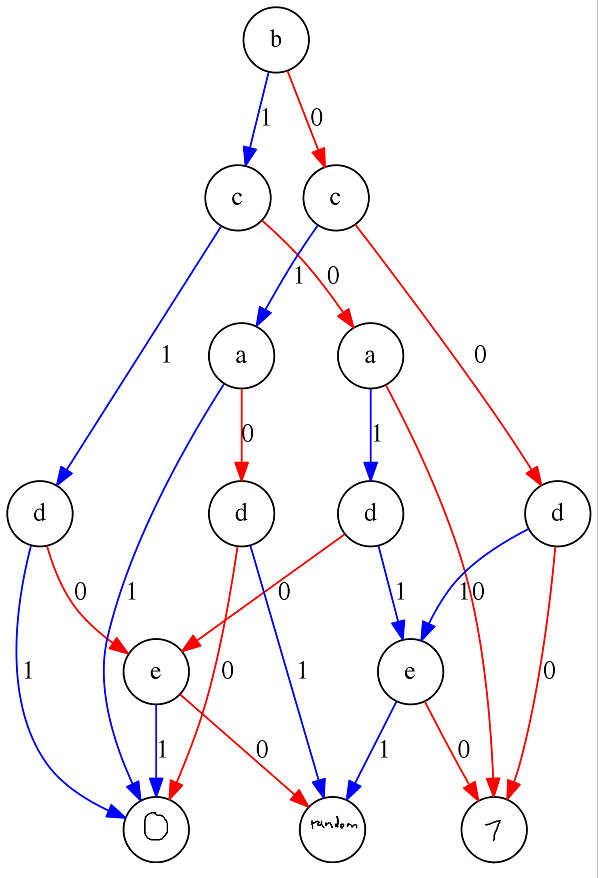 The Mystery Table as a BDD - simplified
Looking at this image, first of all let me say that I do apologize for my hand writing, on behalf of this and all of the upcoming figures.
So what do we learn? A lot, actually! Here is a list of a few things that caught my eye looking at this diagram for the first time.
Before investigating the d/e layers closer, let's visualize what we have so far.
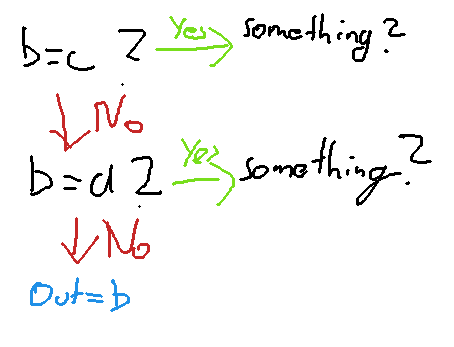
Here is an updated view of our BDD, indicating which parts we have interpreted and which ones we still need to interpret.
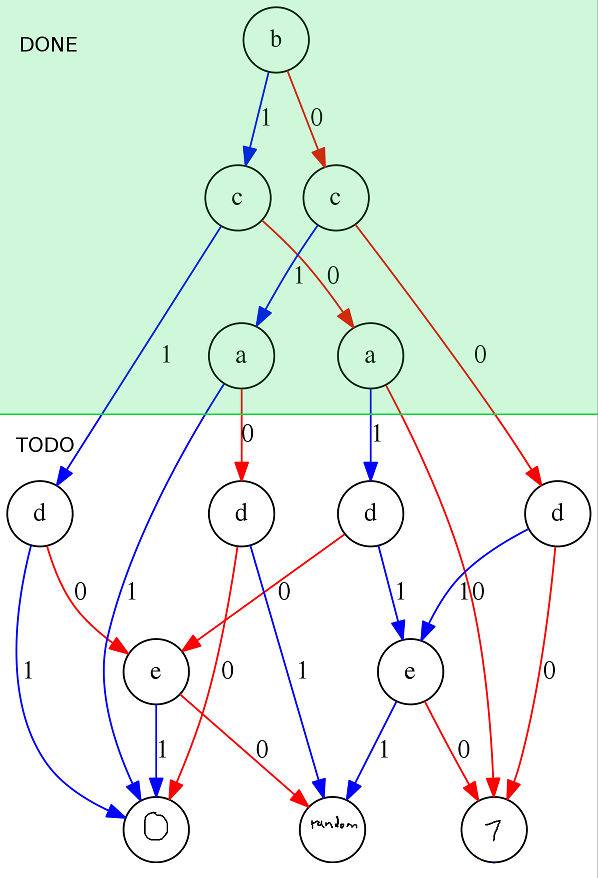
Let's continue with the outermost d nodes on the left and right. Some observations:
With these observations made, let's update our visualization,
We have most of the BDD covered already.
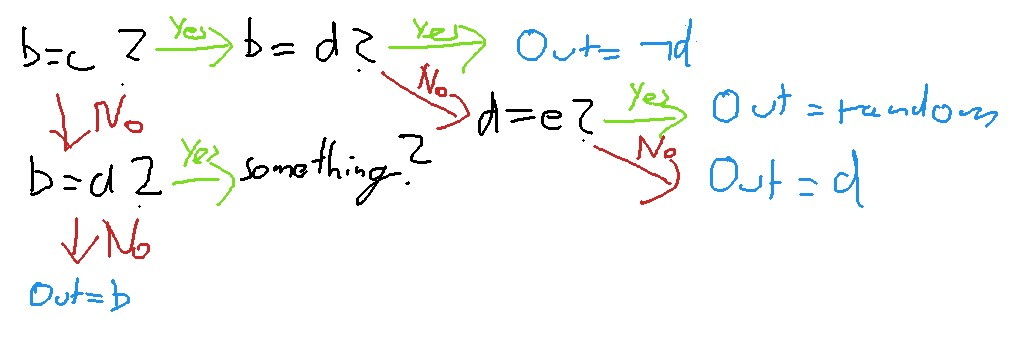
The only part missing are the two center d nodes. Let us recall how we end up in these nodes.
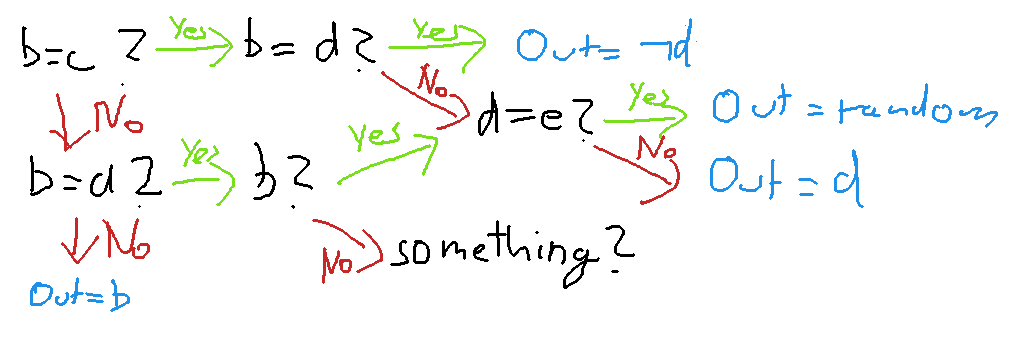
So all the we still need to interpret is the left d node out of the two center nodes, where we land if b ≠ c, b = a, and b = 0. Here, we ignore e entirely. Instead, we output 0 if d is 0, and random if d is 1. Looks familiar? Actually, instead of saying we output 0 if d is 0, an we can also say that we output d if d is 0, which leads us to a node that is very similar to the previous d=e? node. So, here is the entire BDD interpreted.
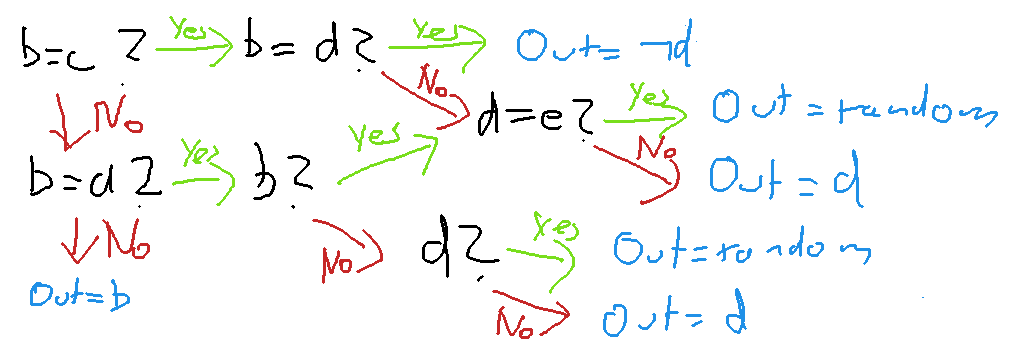
Progress! Starting from a table with 32 rows, we have simplified things to a simple diagram in which we use between two and four checks to conclude that the output is one of b, d, ¬d or random. That said, even this simpler diagram felt too complex to be the actual original intention of that drunk developer. I would need one last step to finally get to not only have established some random structure in the Mystery Table, but to find an explanation that actually made sense intuitively.
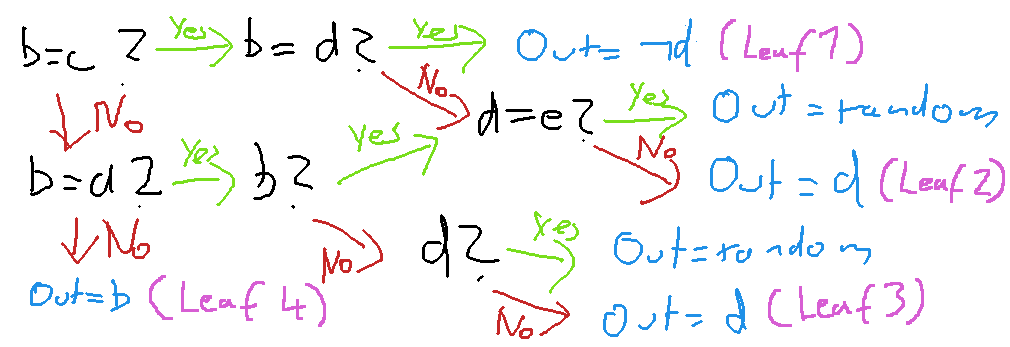
As much as the diagram I obtained by interpreting the BDD felt like somewhat of an improvement over the original table, I just could not find any way to explain it in a simpler way that makes intuitive sense for a human. One major issue I had with the diagram is that it is just to a lot to keep in mind. Something along the lines of "if b = c, and b ≠ d, and d ≠ e we output d" just does not seem like a rule made by a human. After trying - and failing - to find simpler, more convincing formulations of these rules for some time, I decided to visualize things once more. For reference, I labeled all of the leaves of the diagram in which the result is not "random". There are four such leaves, Leave 1 to Leave 4, or L1 to L4 for short. Here is a labeled version of the diagram.
Next, I visualized for each leave the patterns that let us end up in that particular leaf, using variables for tiles that need to have the same or opposite values without really being restricted any any specific value. Here are these patterns.
Here, a tile labeled with b can either be empty or a wall, as long as it is the same as tile b, and so forth. Tiles labeled with an asterisk * can either be empty or a wall, and their value does not matter. Note that there are two patterns corresponding to leaf 2, depending on whether we reached it through the upper path (L2a) or the lower path (L2b).
Looking at these patterns, I finally felt that I was starting to understand the logic behind the Mystery Table!
To better illustrate, here are the three forbidden patterns.
The forbidden patternsMy conjecture at this point was that the Mystery Table is designed to prevent all three patterns. For the block shape and the inverted V-shape this is definitely the case, through patterns L1 and L4. Unfortunately, L2a does not exactly correspond to the normal V-shape, so I would need to look into this shape further. To be precise, L2a prevents the generation of a V-shape only if b and c are equal. So what in the case where b and c are not equal? Is it possible to create a V-shape in those cases? In fact, it is not, and there are two ways show that this is the case. Either by carefully examining patterns L2b and L3 which, as we can show, end up preventing the generation of a V-shape even if b ≠ c. Or, we go back to the original Mystery Table and take a look at all rows that potentially could allow us to generate a V-shape and check all of them systematically. Here, I will use the second approach, as it is a lot easier to understand and less convoluted. So, below is the original Mystery Table, will all rows that could potentially result in a V-shape highlighted.
Looking at these highlighted entries, it is easy to see that in cases where c = ¬d = e, X is, indeed always equal to ¬d, meaning that it is impossible to ever generate a V-shape.
So, the next question is how many rows of the mystery table have we explained, and how many are still left. Let's plot the whole table out again, this time sorting rows by which rule they correspond to.
As you can see, we are not entirely done. Two rows from the Mystery Table are not explained by the three patterns. We will ignore these for now, and take a closer look later.
At this point, we are able to explain 24 out of 26 non-random rows of the Mystery by just three simple patterns. But is our explanation just an explanation for the rows, or did we really discover the original intention of the original developer? While there is no way to tell for sure, personally I believe that we did actually discover the original intention. For one, once I got to this point, I felt that the explanation by patterns is so simple and easy to understand that I felt stupid for not seeing it in the first place. Personally I think that this is a good indication that it really is the correct interpretation. Second, I could also not help but notice that the abcde pattern used as input for the Mystery Table corresponds exactly to what we get by overlaying the three shapes on top of each other, as seen below.
So I had not only discovered a possible explanation for most of the Mystery Table, but also accidentally discovered the origin of the pattern at the same time.
So why do these rules make sense? Well, the "no blocks" rule just keeps things more interesting, and maze-like. Having areas consisting of just a single type of tile is not really interesting, nor does it really look like a proper maze. Even worse, a block of 2x2 walls blocks a precious amount of space, making it more likely that we generate unsolvable mazes.
So what about the V and the inverted V? First of all, preventing those two shapes indirectly prevents the generation of isolated tiles that do not connect to any tile of the same type on any of their four sides, as such an isolated tile basically corresponds to an inverted V and a normal V overlapping.
More generally, forbidding the these V-shapes corresponds to forbidding corridors and walls to end vertically, as such an end to a corridor or wall would also be a (inverted) V-shape:
So why forbid vertical ends to walls or corridors? For one, forbidding some types of ends, makes it generally less likely for features to end, and leads to more connectivity. This is desirable in order to generate something that resembles an actual maze rather than just a bunch of disconnected walls and corridors. Second, forbidding vertical ends rather than horizontal ones makes sense, because the player needs to move vertically through the maze, so vertical connectivity is very much desired.
At this point I should note that when you play Entombed, you may notice that you occasionally do encounter the shapes we just discussed. This has two reasons.
Let us return to the two table rows still need explanation.
As we only have two patterns to work with, and two that are very different from each other, I am afraid we will not be able to discern any simple, general pattern for these two rows. One thing the two rows have in common, though, is that they exclusively generate empty tiles. This leads me to believe these rules were added to make the game a bit more playable, by adding a slight bias towards more empty tiles.
Next, let us look at each row individually. Row 4 essentially forces a connection of two horizontal hallways in a situation where they would otherwise touch diagonally. This adds more horizontal connections between hallways than would otherwise exist. Such horizontal paths create choices for the player and feel like a good way to make things more interesting.
Row 25 continues a hallway vertically in one situation where it otherwise end horizontally to the right (it is still possible to end towards the right if a is an empty tile). This serves similar goals as the (inverted) V-shape rules. It favors connectivity, in particular in the vertical direction.
With these two explanations added for the one-off rows, here is the entire Mystery Table sorted by rule.
The Mystery Table decipheredWell, for one, we discovered the secret behind the Mystery Table. It is designed to prevent three distinct patterns of tiles from occurring in the maze, and to slightly tilt the odds towards continuous hallways on top of that.
More generally, we looked at a possible way to make sense out of seemingly random data. Rather than trying to find patterns in the data directly, sometimes it can beneficial to look for a different representation of the data first. If we can find a more concise representation of the same data, it may be easier for us to reason about it, and some of the ways we are able to compress the data might directly be linked to its underlying hidden structure.
Thanks for reading!